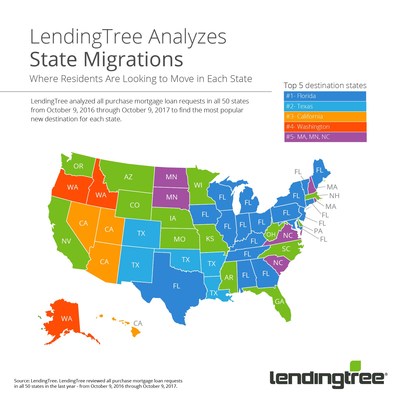
LendingTree®, a leading US online loan marketplace provider, financial has recently released the findings of its study on where residents in each state are looking to move, which discovered a southern tilt in preferences of out-of-state home buyers.
The study reviewed purchase mortgage loan requests for primary residences in all 50 states in the last year – from October 2016 through October 2017 – to find the percentage of all requests from residents looking to move outside of their current state. The results reveal the most popular new destination for each state along with the percentage of out-of-state requests for that location.
|
State |
Percentage |
Top New State |
Percentage (of out-of-state |
|
VT |
24.07% |
FL |
14.01% |
|
HI |
23.10% |
CA |
12.67% |
|
AK |
22.51% |
WA |
11.24% |
|
ND |
21.50% |
MN |
27.42% |
|
WY |
21.09% |
CO |
15.87% |
|
NY |
20.80% |
FL |
21.57% |
|
RI |
20.67% |
MA |
31.00% |
|
NH |
19.17% |
MA |
22.00% |
|
CT |
19.09% |
FL |
22.50% |
|
MD |
18.94% |
FL |
13.00% |
|
DE |
18.64% |
PA |
22.03% |
|
NJ |
18.08% |
FL |
21.09% |
|
MA |
17.86% |
NH |
19.89% |
|
SD |
17.27% |
MN |
11.80% |
|
VA |
17.05% |
NC |
17.35% |
|
KS |
16.39% |
MO |
29.67% |
|
WV |
16.04% |
OH |
15.41% |
|
NV |
15.36% |
CA |
17.73% |
|
IL |
14.66% |
FL |
14.07% |
|
CO |
14.50% |
TX |
10.87% |
|
NM |
14.44% |
TX |
24.93% |
|
CA |
13.96% |
NV |
10.64% |
|
PA |
13.47% |
FL |
17.14% |
|
MO |
13.40% |
KS |
12.95% |
|
NE |
13.04% |
IA |
16.64% |
|
ME |
12.99% |
FL |
22.11% |
|
OR |
12.95% |
WA |
26.67% |
|
WA |
12.91% |
OR |
11.08% |
|
MT |
12.30% |
AZ |
10.50% |
|
UT |
12.29% |
CA |
10.88% |
|
ID |
12.15% |
WA |
18.88% |
|
IA |
11.89% |
FL |
10.38% |
|
AZ |
11.79% |
CA |
13.54% |
|
MN |
11.75% |
WI |
17.27% |
|
MS |
11.45% |
AR |
16.30% |
|
WI |
11.45% |
FL |
14.10% |
|
KY |
11.11% |
FL |
15.81% |
|
TN |
11.07% |
FL |
16.19% |
|
LA |
10.98% |
TX |
23.07% |
|
NC |
10.64% |
SC |
26.91% |
|
AL |
10.30% |
FL |
22.09% |
|
SC |
10.18% |
NC |
29.97% |
|
IN |
10.13% |
FL |
18.24% |
|
AR |
9.73% |
TX |
17.17% |
|
GA |
9.68% |
FL |
26.32% |
|
OK |
9.68% |
TX |
23.64% |
|
OH |
9.66% |
FL |
19.83% |
|
FL |
9.51% |
GA |
12.04% |
|
MI |
9.18% |
FL |
21.52% |
|
TX |
7.46% |
FL |
10.49% |
Key Findings:
Florida is the number one destination.
Florida was the number one new destination for 18 of the 50 states. Of all purchase mortgage requests during the study’s time period, 9.14% were for consumers looking to move to Florida. The Sunshine State has a history of bringing in visitors and new residents, particularly retirees.
Texas residents love the Lone Star State.
Texas had the highest percentage of residents looking to move within the state versus outside of the state. 92.54% of purchase mortgage requests from individuals in Texas were for properties within the state. The second location with the highest percentage of residents looking to move within the state was Michigan.
Vermont has the most residents looking to move away.
In contrast to Texas, Vermont had the lowest percentage of residents looking to stay in state. 75.93% of requests in Vermont were for properties within the state.
If individuals are looking to move outside of state, most don’t want to go far.
More than half of the most popular new destination states border the current state. Of the states that the residents’ most popular new location does not border their current state, 16 were Florida.
South Carolina leads out-of-state mover popularity.
LendingTree created a Moving Popularity Score Index* to analyze destination states adjusted by population. South Carolina scored highest, as mortgage loan requests from out-of-state movers were 56% greater than suggested by its share of the national population. Other popular states are Florida, Delaware, North Carolina and Georgia, revealing a southern tilt in the preferences of out-of-state home buyers. At the other end of the spectrum, home buyers were least attracted to South Dakota, which received just 71% of the loan requests its population would suggest. California, Minnesota, North Dakota and Hawaii complete the bottom five.
|
State |
Moving |
|
SC |
156 |
|
FL |
143 |
|
DE |
139 |
|
NC |
135 |
|
GA |
134 |
|
NV |
125 |
|
NH |
123 |
|
TN |
119 |
|
WV |
118 |
|
MS |
112 |
|
AL |
112 |
|
KY |
112 |
|
MT |
112 |
|
AR |
110 |
|
IN |
110 |
|
CO |
109 |
|
AZ |
109 |
|
OH |
108 |
|
ME |
107 |
|
TX |
105 |
|
ID |
104 |
|
VT |
103 |
|
VA |
102 |
|
OR |
100 |
|
LA |
100 |
|
MO |
100 |
|
MD |
98 |
|
OK |
97 |
|
PA |
96 |
|
WY |
94 |
|
NM |
92 |
|
NE |
91 |
|
NJ |
91 |
|
KS |
91 |
|
MI |
89 |
|
CT |
88 |
|
IA |
88 |
|
WA |
86 |
|
UT |
86 |
|
RI |
86 |
|
MA |
83 |
|
AK |
83 |
|
WI |
82 |
|
IL |
79 |
|
NY |
79 |
|
HI |
77 |
|
ND |
77 |
|
MN |
76 |
|
CA |
72 |
|
SD |
71 |
*Moving Popularity Score Index Methodology
The popularity score for each state was created by dividing the percentage of all out-of-state mortgage requests for the state by the percentage total population each state represents. A score of 100 means a state receives loan requests proportional to its population, above 100 means a state is more popular than its share of the national population and below 100 means a state is less popular than its share of the national population. For example, South Carolina represents 2.40% of all out-of-state mortgage requests, and its population is 1.54% of the nation. So, the South Carolina score is 2.40/1.54 x 100, or 156.
For more information on the study, visit https://www.lendingtree.com/home/mortgage/where-residents-look-to-move/.


